Quickly see when and why Sentry dropped error events, spans, logs, and metrics data, right in your Explore charts. This makes it easier to differentiate a real change in your data versus missing data, so you can trust the answers you get.
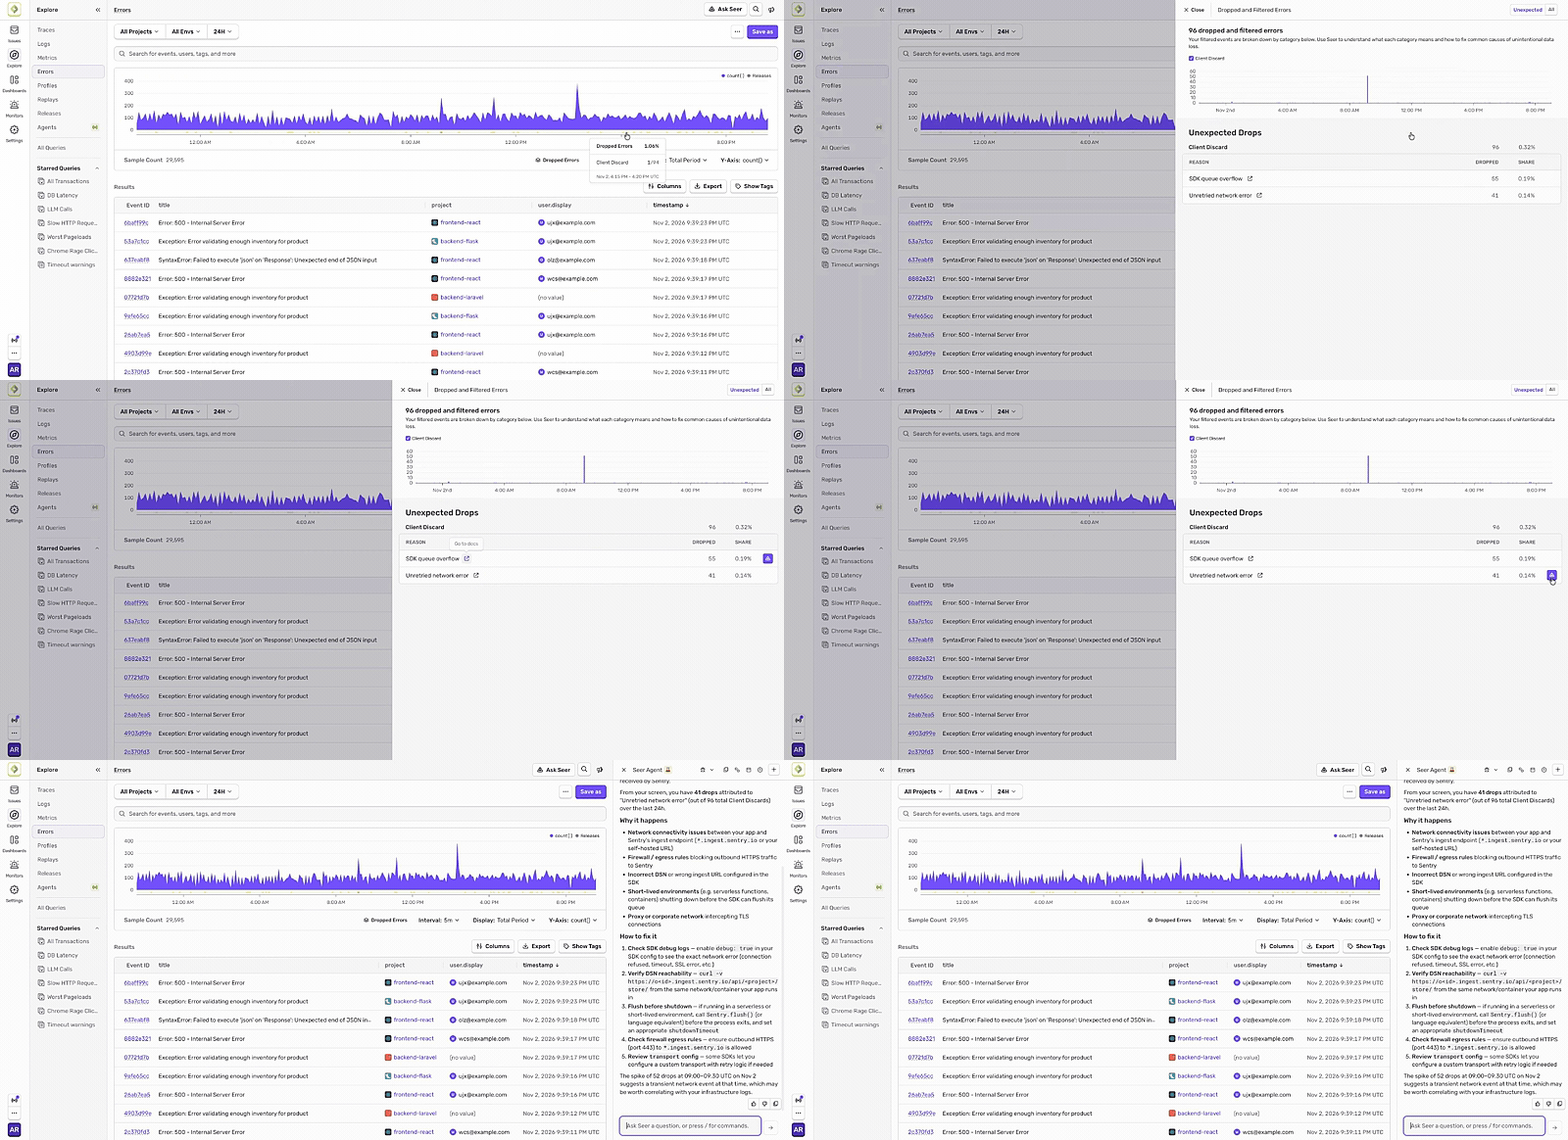
Dropped data appears as a bar along the bottom of each chart. Hover over the bar to see the percent of data lost and click it and you’ll get a breakdown of what was dropped, grouped by reason.
From there, click a dropped reason to open the docs for more detail and suggested fixes. You can also ask Seer Agent, available for free in beta for all Sentry customers, why your data is being dropped and have it suggest a possible fix for you.
We’ve also added a new MCP tool, find_dropped_events, so your agents know exactly what’s missing and why.
The dropped data is now generally available. Learn more about in our docs.
 Github
 Slack